What makes a state a desirable place to practice physical therapy?

The answer of course depends in part on what you value. How important is salary? Quality of life? Future job prospects? Fewer regulatory restraints? Demographic characteristics (such as age and health) of the state's residents? And so on.
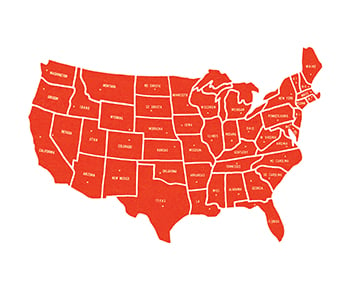
Feature - Best States in Which to Practice

Many rankings of "best states" in fields ranging from health care to retirement use some combination of these factors. PT in Motion's analysis uses dozens of data sources to build on 8 criteria:

Log in or create a free account to keep reading.


Join APTA to get unlimited access to content.

  1. State of American Well-being 2016. Gallup-Healthways. http://www.well-beingindex.com/. Accessed August 16, 2017.
  2. Witters D. Utah Poised to Be the Best U.S. State to Live in. Gallup. August 7, 2012. http://www.gallup.com/poll/156449/utah-poised-best-state-live.aspx. Accessed August 6, 2013.
  3. Lewis K, Burd-Sharps S. The Measure of America 2013-2014. The Milken Institute.www.measureofamerica.org/measure_of_america2013-2014. Accessed August 16, 2017.
  4. Drug Overdose Death Data. Centers for Disease Control and Prevention. https://www.cdc.gov/drugoverdose/data/statedeaths.html. Accessed August 17, 2017.
  5. National Assessment of Adult Literacy (NAAL) National Center for Education Statistics, Institute of Education Sciences. http://nces.ed.gov/naal/. Accessed August 17, 2017.
  6. DeNavas-Walt C, Proctor BD. Income and Poverty in the United States: 2013. September 16, 2014. United States Census Bureau. http://www.census.gov/library/publications/2014/demo/p60-249.html. Data: http://www.census.gov/hhes/www/poverty/data/incpovhlth/2013/state.xls. Accessed August 17, 2017.
  7. File T, Ryan C. Computer and Internet Use in the United States: 2013. US Department of Commerce. United States Census Bureau. http://www.census.gov/history/pdf/2013computeruse.pdf. Accessed August 17, 2017.
  8. 2011-2015 American Community Survey 5-Year Estimates. US Census Bureau. https://factfinder.census.gov/faces/tableservices/jsf/pages/productview.xhtml?pid=ACS_15_5YR_S1501. Accessed July 2, 2017.
  9. 2011-2015 American Community Survey 5-Year Estimates. US Census Bureau. https://factfinder.census.gov/faces/tableservices/jsf/pages/productview.xhtml?pid=ACS_15_5YR_S1501. Accessed July 2, 2017.
  10. National Health Literacy Mapping to Inform Health Care Policy (2014). Health Literacy Data Map. University of North Carolina at Chapel Hill. 2014. http://healthliteracymap.unc.edu/#. Accessed August 17, 2017.
  11. Puente L. 2016 Thumbtack.com small business friendliness survey: Methodology & Analysis. 2016. https://www.thumbtack.com/survey#/2016/1/states. Accessed August 15, 2017.
  12. America's Top States for Business 2017. CNBC. https://www.cnbc.com/2017/07/11/americas-top-states-for-business-2017.html. Accessed August 22, 2017.
  13. Levels of Patient Access to Physical Therapist Services in the States. American Physical Therapy Association. May 2016. http://www.apta.org/uploadedFiles/APTAorg/Advocacy/State/Issues/Direct_Access/DirectAccessbyState.pdf. Accessed August 22, 2017.
  14. State Telehealth Laws and Reimbursement Policies. The National Telehealth Policy Resource Center, Center for Connected Health Policy. April 2017. http://cchpca.org/state-telehealth-laws-and-reimbursement-policies-report. Accessed August 22, 2017.
  15. America's Top States for Business 2017: A scorecard on state economic climate. CNBC. https://www.cnbc.com/2017/07/11/americas-top-states-for-business-2017.html. Accessed August 17, 2017.
  16. Hospitals Participating in the CMS EHR Incentive Programs. Office of the National Coordinator for Health Information Technology. Health IT Quick-Stat #45. dashboard.healthit.gov/quickstats/pages/FIG-Hospitals-EHR-Incentive-Programs.php. August 2017. Accessed August 22, 2017.
  17. DeVol R, Lee J, Ratnatunga M. State Technology and Science Index 2016. The Milken Institute. 2016. http://assets1b.milkeninstitute.org/assets/Publication/ResearchReport/PDF/State-Technology-and-Science-Index-2016.pdf. Accessed August 22, 2017.
  18. 2016 PT/PTA Market Share by State. http://www.apta.org/MembershipDevelopment/Statistics/. Accessed August 17, 2017.
  19. Occupational Employment Statistics. Occupational Employment and Wages, May 2016. SOC code 291123 Physical Therapists. Bureau of Labor Statistics. http://www.bls.gov/oes/current/oes291123.htm. Accessed August 17, 2017.
  20. Cost of Living Data Series First Quarter 2017. Missouri Economic Research and Information Center. https://www.missourieconomy.org/indicators/cost_of_living/. Accessed August 17, 2017.
  21. Health Disparities Profiles: 2014 Edition. Washington, DC:DHHS Office on Women's Health. 2014. http://www.womenshealth.gov/quickhealthdata. Accessed August 17, 2015.
  22. Women's Health and Mortality Chartbook: 2014Edition. Washington, DC: DHHS Office on Women's Health. 2014. http://www.womenshealth.gov/quickhealthdata. Accessed August 17, 2015.
  23. 2010-2014 American Community Survey 5-Year Estimates. American FactFinder, US Census Bureau. http://factfinder.census.gov/faces/nav/jsf/pages/searchresults.xhtml. Accessed August 4, 2016.

You Might Also Like...

Article

Medicare Participation: You Have Options

Jun 25, 2025

First time enrolling in Medicare? Looking to change your participation status? This resource serves as your guide to the two types of Medicare participation

Article

APTA Champions Return of Bill to Expand Access to Pelvic Health Physical Therapy

Jun 24, 2025

APTA and APTA Pelvic Health are advocating to improve access to vital postpartum care, including pelvic floor physical therapy. This persistence is paying

Article

APTA Advocacy Leads to Direct Access for Millions Covered by Aetna

Jun 17, 2025

The Big Picture of Aetna’s Policy Change In response to ongoing advocacy efforts by APTA, Aetna has updated its physical therapy policy to provide unrestricted